Sunday, October 10. 2010
Employment - When will it Improve?
How long until our country returns to pre-recession employment levels? I have included two graphs to illustrate that the timeframe to return to past employment levels is a long way off. The first graph comes from calculatedriskblog.com.
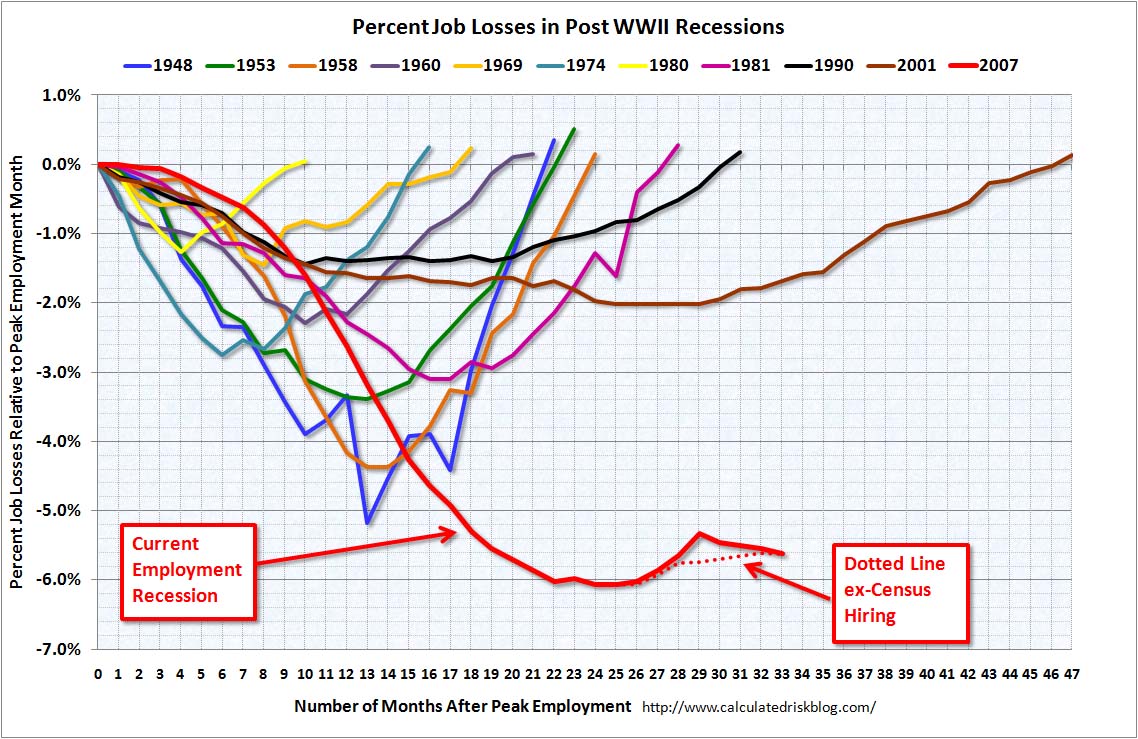
The graph shows the number of months that it took for employment levels to return to pre-recession levels. The chart shows the last 11 recessions our country has had. What is notable about the graph is that each of the recessions has a similar pattern. The graph has a declining slope followed by a trough and then a positive slope as the employment level returns to pre-recession levels. It is interesting that each of the lines appear similar to an inverted bell curve. Therefore, we could take each of the lines and look at the number of months to the trough and make a similar estimate of how long it will take us to return to full employment (as determined by the starting level.) In that case it suggests that it will be at least 24 months until we return to pre-recession employment levels.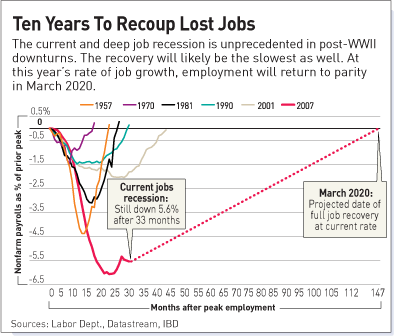
calculatedriskblog.com joblossesrecessionssep2010
The graph shows the number of months that it took for employment levels to return to pre-recession levels. The chart shows the last 11 recessions our country has had. What is notable about the graph is that each of the recessions has a similar pattern. The graph has a declining slope followed by a trough and then a positive slope as the employment level returns to pre-recession levels. It is interesting that each of the lines appear similar to an inverted bell curve. Therefore, we could take each of the lines and look at the number of months to the trough and make a similar estimate of how long it will take us to return to full employment (as determined by the starting level.) In that case it suggests that it will be at least 24 months until we return to pre-recession employment levels.
The second chart comes from Investors Business Daily and suggests that we will not return to the same employment level until the year 2020.
IBD - caphilljobs1011
Either of the scenarios involves too much time. Keep in mind that our economy is supposedly fueled 70% by consumer activity. If we do not have the jobs, people will not have the income to meet their financial obligations nor spend on other purchases. This will further create a downward spiral and inhibit the growth of our economy. This also suggests that the consumer will not generate excess funds to pay for the future taxes resulting from the various stimulus packages.
(c) 2010 Jim Lindell
Trackbacks
Trackback specific URI for this entry
No Trackbacks
Jim Lindell
Jim Lindell is a National Speaker, Author, and Vistage Chair. He is motivated by helping others improve their lives and businesses.
He is President of Thorsten Consulting Group, Inc.
Order Jim's book - "Controller as Business Manager". Controller as Business Manager
He is President of Thorsten Consulting Group, Inc.
Order Jim's book - "Controller as Business Manager".
controller as business manager - jim lindell - thorsten consulting group
Quicksearch
Archives
Categories
Syndicate This Blog

Blog Administration
Powered by

Ontoplist Blog

