Wednesday, May 4. 2011
Newspaper Circulation Continues to Drop
Monday, April 25. 2011
Inflation - UP, UP and Awaaaaaaaay
 Kimberly-Clark Posts Softer 1Q Profit, Will Raise Prices (Source: http://fxn.ws/ez8Q70) FOXBusiness By Matt Egan Published April 25, 2011
CHICAGO – Kimberly-Clark (KMB) suffered a steeper-than-expected 8.9% slide in first-quarter profits as the maker of Kleenex tissues grappled with higher prices.
“We continue to execute our global business plan strategies in a difficult environment,” CEO Thomas Falk said in a statement.
Kimberly-Clark announced plans to raise prices in a “number” of its businesses, including North American consumer products.
“The rapid run-up in commodity costs has influenced our near-term profitability, so we are taking aggressive actions in response to the cost environment,” Falk said.
In light of the higher prices, Kimberly-Clark lowered its 2011 non-GAAP EPS forecast to $4.80 to $5.05, compared with $4.90 to $5.05 previously. Yet the company now sees full-year sales rising 4% to 6%, up from 3% to 4% previously. Organic sales are expected to rise 2% to 4%.
Shareholders punished Kimberly-Clark for the earnings miss and new guidance, sending the stock down 3.1% to $64.00 ahead of Monday’s open. The company’s shares finished last week up nearly 5% on the year.
Read more: http://www.foxbusiness.com/industries/2011/04/25/kimberly-clark-posts-lower-profit-says-raise-prices/#ixzz1KXjPHFVH
Thor's Hammer Note: Inflationary pressures continue to build throughout the economy. The thought of inflation was laughed at a couple of years ago and now it is impossible to read current news articles without noting some reference to the inflation spectre. Expect continued price increases in all of our daily expenses. Also expect to see confusion on the part of politicians as they struggle with an issue that they have contributed to. We are in trouble folks ...
© 2011 - Jim Lindell
Wednesday, March 16. 2011
Newspaper Ads Sag - Industrial Production Shows Bleak Trend
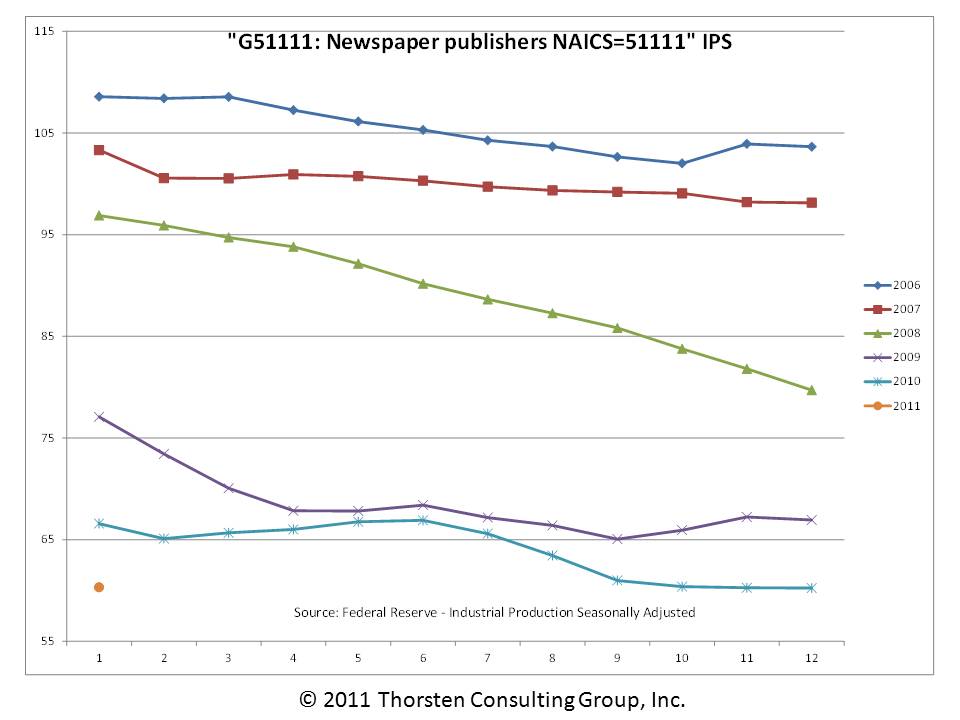
Newspaper ads sag to a 25-year low in 2010.
Newspaper advertising falls to lowest level since 1985 despite gradual easing of 4-year slump
SAN FRANCISCO (AP) -- Newspaper advertising in the U.S. has sunk to a 25-year low as marketing budgets followed readers to the Internet, where advertising is far cheaper than what publishers have been able to command in print.
Advertisers spent $25.8 billion on newspapers' print and digital editions last year, according to figures released Tuesday by the Newspaper Association of America. That's the lowest amount since 1985 when total newspaper advertising stood at $25.2 billion.
After adjusting for inflation, newspaper advertising now stands at about the same level as nearly 50 years ago. In 1962, newspaper advertising totaled $3.7 billion, which translates to about $26 billion today.
Author's Note: Many times the public stories of a changing industry can be easily seen in the underlying data. The data for the chart comes from the Federal Reserve. Note how each of the years are a continuous decline. Also note that 2011 starts off lower than the preceding years on the chart. This chart shows no sign of changing course. The Newspaper industry is in dire straits.
© 2011 Jim Lindell - Thorsten Consulting Group, Inc.
Friday, March 11. 2011
Selzer Poll - Bloomberg - Consumers with Gloomy Outlook
Friday, January 7. 2011
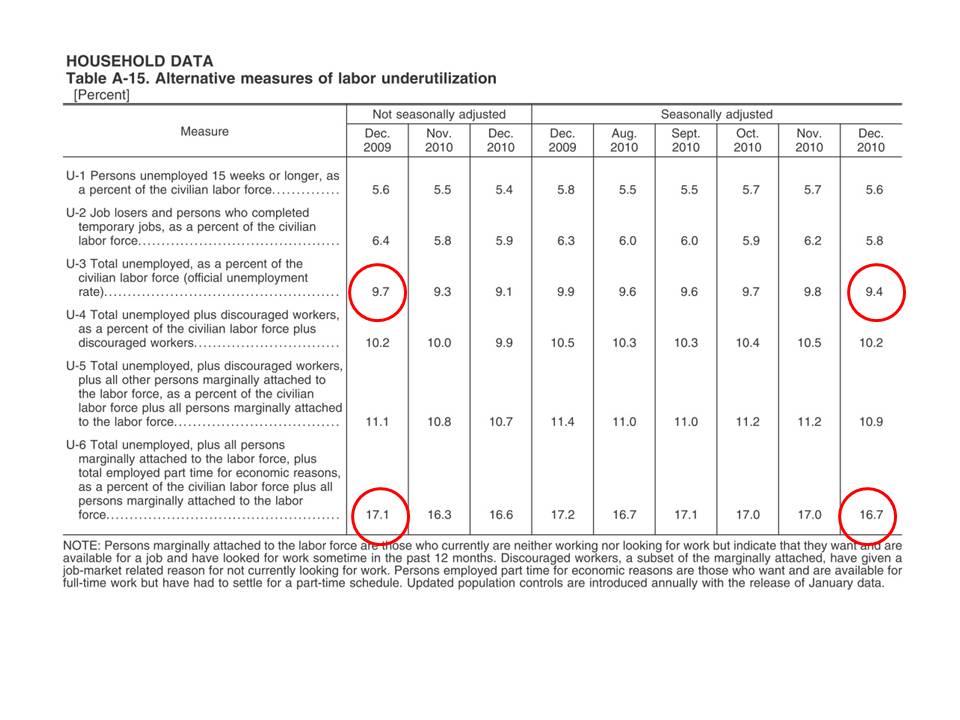
December Unemployment Just Released
Thorsten Consulting Group, Inc. - 2011
The U-3 number is the rate that everyone talks about in the paper or in the media. It was well into the recession before people started discussing the U-6 rate which represents all unemployment. By the way, the BLS #’s do not include the long term discouraged workers over 12 months. Overall unemployment is actually over 21%. If you have not had exposure to this last piece of info, I would suggest visiting http://www.shadowstats.com.
Tuesday, January 4. 2011
States Face Budget Crisis - Impact on Taxpayers?
Saturday, November 27. 2010
Shopping and Materialism getting out of hand!
Tuesday, November 23. 2010
Jobs - When will they Return?
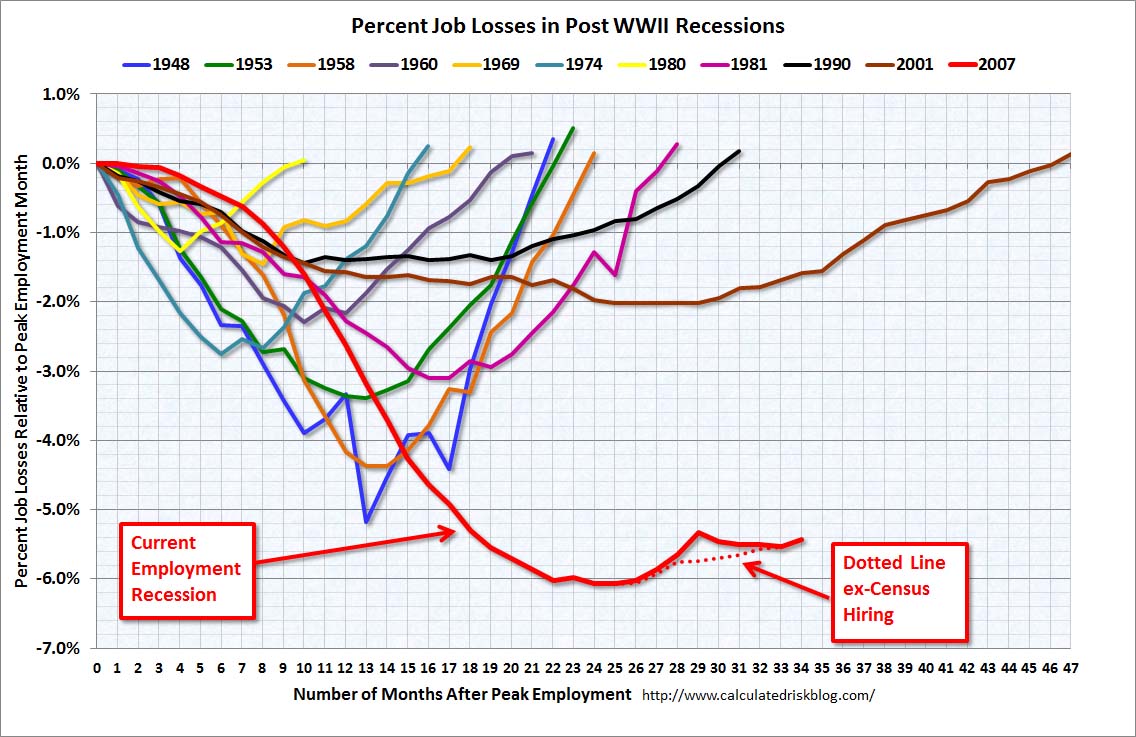
One of the key signs to the economy recovering will be the return of jobs for the unemployed. Since the economy is driven by the consumer, the consumer must have funds (i.e. jobs) to fuel the recovery. The following graph is from http://calcualtedriskblog.com. Note that the previous 11 recessions have followed a similar pattern in terms of job recovery. Unfortunately, the length of time to return to pre-recession job levels in each of the recessions has been getting longer. Also remember that the 2001 recession was known as a jobless recovery. If the trend continues, it does not bode well for the return of jobs. Based on the chart, it does not appear that we will return to pre-recession employment levels for at least a couple of years in the best circumstances. Investors Business Daily used the same information and predicted that the jobs would not return to the same levels until March of 2020. Keep tight reins on your costs. Contrary to the NBER's declaration, we are not out of the recession. © Jim Lindell 2010
Friday, November 19. 2010
Pension Crisis - Study from Northwestern University
Monday, November 15. 2010
NY Fed - Business Conditions deteriorating
Sunday, November 14. 2010
Unemployed - Real life examples
Friday, October 22. 2010
What Makes Life Worthwhile
Tuesday, October 19. 2010
Employment Rate Compared to Appliances Furniture Carpeting
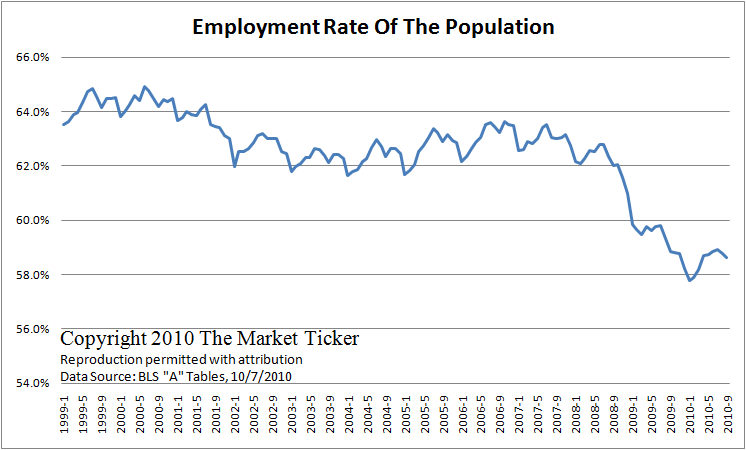
I just saw this graph from the market ticker (source: http://market-ticker.org/). Note the drop off in the employment rate. Specifically compare the timeframe from 2006 forward and then refer to my previous post re: Appliances, Furniture and Carpeting. Do you see the same slope? Our economy which is purportedly driven by the consumer (70%), is being impacted by the lack of employment. The lack of employment translates into a lack of disposable funds and results in decreased consumption. We need jobs for our country!
(c) 2010 - Jim Lindell
Tuesday, October 19. 2010
Appliances, Furniture and Carpeting Industrial Production Decreases
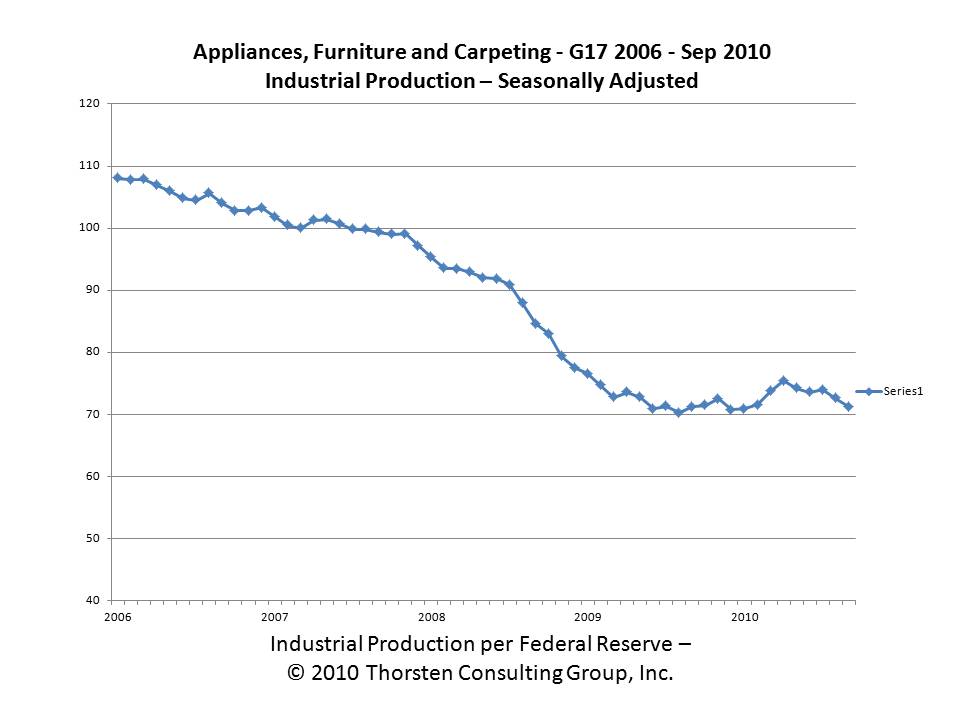
The Industrial Production for Appliances, Furniture and Carpeting (Seasonally Adjusted) shows continuing decreases. This trend is dependent on the housing industry. As the housing industry continues to be depressed, the related industries will also experience difficult times. We are also moving to the slower housing time of the year. Expect these industries to remain depressed. (c) 2010 - Jim Lindell
Monday, October 18. 2010
September 2010 Industrial Production and Capacity Utilization
Industrial production decreased 0.2 percent in September after having increased 0.2 percent in August. The indexes both for manufacturing and for manufacturing excluding motor vehicles and parts also moved down 0.2 percent in September. Production at mines moved up 0.7 percent, while the output of utilities fell 1.9 percent. For the third quarter as a whole, total industrial production rose at an annual rate of 4.8 percent after having advanced about 7 percent in both the first and second quarters of this year. The index for manufacturing decelerated sharply in the third quarter: After having jumped at an annual rate of 9.1 percent in the second quarter, factory output gained 3.6 percent in the third quarter. At 93.2 percent of its 2007 average, total industrial production in September was 5.4 percent above its year-earlier level. The capacity utilization rate for total industry edged down to 74.7 percent, a rate 4.2 percentage points above the rate from a year earlier but 5.9 percentage points below its average from 1972 to 2009.
Jim Lindell
He is President of Thorsten Consulting Group, Inc.
Order Jim's book - "Controller as Business Manager".

Quicksearch
Archives
Categories
Syndicate This Blog

Blog Administration
Powered by

Ontoplist Blog

