Wednesday, August 25. 2010
Health: Teens & Text Addiction
Monday, August 23. 2010
Ship and Boat Building - Understand the Economy for Yourself
Understand the Economy for yourself. Don’t be over-reliant on the good opinion of other people. Many individuals are unaware of the free resources that are available to track economic trends. One of the best tools comes from the Federal Reserve at http://www.federalreserve.gov/releases/g17/ipdisk/alltables.txt
The page shows the industrial production by industry for both seasonal and non-adjusted data. In essence, if you want to track a particular industry, there is no need to wait to read the information in a newspaper or a blog. Get the information for yourself and make your own interpretation. For example, the ship and boat building industry data (not seasonally adjusted) is presented as of July 2010 from the link previously referred to. Each of the columns represents monthly data. The data is also listed as IPS – Industrial Production Seasonally Adjusted or IPN - Industrial Production Not Seasonally Adjusted. The following information then is not seasonally adjusted. (Note: The series in the data is: Series ID, Year, Jan - Dec)
G3366: Ship and boat building boat building NAICS= 3366
IPN.G3366 1998 77.7154 76.4769 77.4417 73.0003 78.4545 77.2793 79.2277 79.9203 77.7161 83.1318 83.3754 85.0114
IPN.G3366 1999 81.2649 83.0248 84.2262 79.4988 80.0477 80.2212 79.1561 87.1829 86.567 86.5657 87.876 91.0407
IPN.G3366 2000 87.5872 90.1602 90.6017 89.0554 86.1863 87.6935 86.631 84.7939 79.8662 82.7261 86.2213 85.5277
IPN.G3366 2001 84.4292 80.6533 85.8832 81.4089 83.0756 82.7078 81.6635 78.0686 80.8324 82.0314 85.0271 86.2545
IPN.G3366 2002 86.5545 84.4315 91.5064 90.9403 93.6875 95.4739 83.8494 89.2274 95.6293 94.3411 91.5129 94.8692
IPN.G3366 2003 91.3116 90.6367 96.6679 92.4623 93.9838 95.8826 84.7913 91.7654 96.7991 95.0387 94.4247 92.2472
IPN.G3366 2004 92.0228 94.1356 104.9366 99.0401 98.7157 96.7238 86.1078 91.8224 96.2436 94.6853 90.7968 91.0349
IPN.G3366 2005 91.8575 96.3021 106.8692 103.1725 100.7357 99.1634 84.572 90.6338 84.0774 91.4369 90.2713 95.5123
IPN.G3366 2006 95.6029 93.4566 104.0523 95.1993 96.4354 100.6408 85.1382 87.9755 94.6969 92.6844 89.7758 95.5011
IPN.G3366 2007 97.0109 92.9683 96.9511 97.1001 101.4735 107.5809 92.3686 96.3188 105.7243 103.0968 102.5471 106.8595
IPN.G3366 2008 108.5889 107.712 112.3035 110.8724 105.2275 112.7792 97.1203 100.4989 97.2664 98.9122 92.4011 91.1939
IPN.G3366 2009 84.9463 78.9674 82.4338 77.0116 83.7825 90.1609 87.2618 90.0689 85.3314 77.3386 77.2099 78.595
IPN.G3366 2010 83.0853 83.7035 90.8107 90.9836 93.3699 92.5587 82.0928
If we were to graph out the data, our chart would look like the following:
It is easy to spot trends in the ship and boat building industry. Unfortunately, there does not appear to be a significantly favorable trend and this industry will continue to experience difficult times. This observation also seems to parallel the other general economic evidence that the economy is not turning around.
This same analysis can be prepared for any industry and should be a regular component of an organization’s competitive intelligence gathering.
© 2010 – Jim Lindell
The page shows the industrial production by industry for both seasonal and non-adjusted data. In essence, if you want to track a particular industry, there is no need to wait to read the information in a newspaper or a blog. Get the information for yourself and make your own interpretation. For example, the ship and boat building industry data (not seasonally adjusted) is presented as of July 2010 from the link previously referred to. Each of the columns represents monthly data. The data is also listed as IPS – Industrial Production Seasonally Adjusted or IPN - Industrial Production Not Seasonally Adjusted. The following information then is not seasonally adjusted. (Note: The series in the data is: Series ID, Year, Jan - Dec)
G3366: Ship and boat building boat building NAICS= 3366
IPN.G3366 1998 77.7154 76.4769 77.4417 73.0003 78.4545 77.2793 79.2277 79.9203 77.7161 83.1318 83.3754 85.0114
IPN.G3366 1999 81.2649 83.0248 84.2262 79.4988 80.0477 80.2212 79.1561 87.1829 86.567 86.5657 87.876 91.0407
IPN.G3366 2000 87.5872 90.1602 90.6017 89.0554 86.1863 87.6935 86.631 84.7939 79.8662 82.7261 86.2213 85.5277
IPN.G3366 2001 84.4292 80.6533 85.8832 81.4089 83.0756 82.7078 81.6635 78.0686 80.8324 82.0314 85.0271 86.2545
IPN.G3366 2002 86.5545 84.4315 91.5064 90.9403 93.6875 95.4739 83.8494 89.2274 95.6293 94.3411 91.5129 94.8692
IPN.G3366 2003 91.3116 90.6367 96.6679 92.4623 93.9838 95.8826 84.7913 91.7654 96.7991 95.0387 94.4247 92.2472
IPN.G3366 2004 92.0228 94.1356 104.9366 99.0401 98.7157 96.7238 86.1078 91.8224 96.2436 94.6853 90.7968 91.0349
IPN.G3366 2005 91.8575 96.3021 106.8692 103.1725 100.7357 99.1634 84.572 90.6338 84.0774 91.4369 90.2713 95.5123
IPN.G3366 2006 95.6029 93.4566 104.0523 95.1993 96.4354 100.6408 85.1382 87.9755 94.6969 92.6844 89.7758 95.5011
IPN.G3366 2007 97.0109 92.9683 96.9511 97.1001 101.4735 107.5809 92.3686 96.3188 105.7243 103.0968 102.5471 106.8595
IPN.G3366 2008 108.5889 107.712 112.3035 110.8724 105.2275 112.7792 97.1203 100.4989 97.2664 98.9122 92.4011 91.1939
IPN.G3366 2009 84.9463 78.9674 82.4338 77.0116 83.7825 90.1609 87.2618 90.0689 85.3314 77.3386 77.2099 78.595
IPN.G3366 2010 83.0853 83.7035 90.8107 90.9836 93.3699 92.5587 82.0928
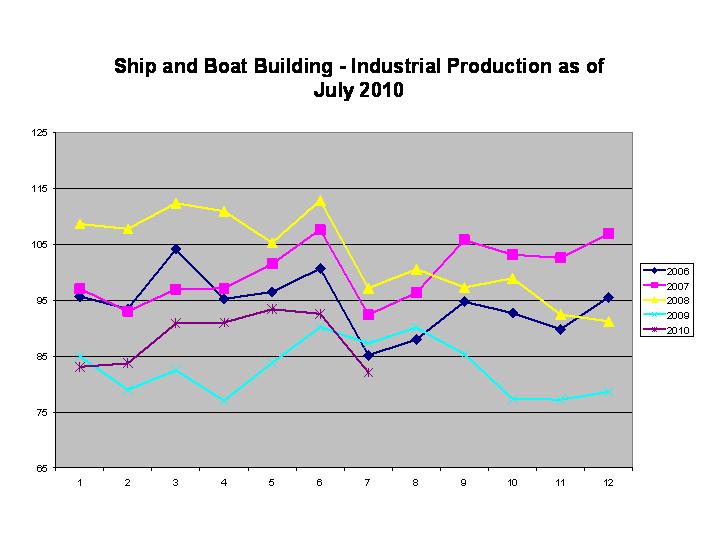
If we were to graph out the data, our chart would look like the following:
Ship and Boat Building Industrial Production July 2010
It is easy to spot trends in the ship and boat building industry. Unfortunately, there does not appear to be a significantly favorable trend and this industry will continue to experience difficult times. This observation also seems to parallel the other general economic evidence that the economy is not turning around.
This same analysis can be prepared for any industry and should be a regular component of an organization’s competitive intelligence gathering.
© 2010 – Jim Lindell
Jim Lindell
Jim Lindell is a National Speaker, Author, and Vistage Chair. He is motivated by helping others improve their lives and businesses.
He is President of Thorsten Consulting Group, Inc.
Order Jim's book - "Controller as Business Manager". Controller as Business Manager
He is President of Thorsten Consulting Group, Inc.
Order Jim's book - "Controller as Business Manager".
controller as business manager - jim lindell - thorsten consulting group
Quicksearch
Archives
Categories
Syndicate This Blog

Blog Administration
Powered by

Ontoplist Blog

